

Understanding and Preventing Led Outdoor Accidents Data System
A theory driven approach to injury surveillance and prevention
Understanding and Preventing Led Outdoor Accidents Data System (UPLOADS) is a sector-wide incident reporting system that was first deployed in organisations across Australia in 2014. It was developed to address the lack of good quality data on injuries and incidents during led outdoor (LOA) activities. UPLOADS uses a System’s Thinking approach and provides a standardised, national approach to incident report and learning for the LOA Sector.
The UPLOADS App is a web-based application and can be accessed from any computer, and this can be done offline. It is used to record: incident reports; LOA participation data; and action plans used to address identified problems. LOA providers are encouraged to use the UPLOADS App to collect and analyse detailed information to detect trends and formulate data-driven incident prevention strategies. The system can also automatically generate reports on your incident data, saving you time.
Other benefits of using the app are:
- Offline reporting from your tablet or phone.
- User friendly incident analysis and generation of reports.
- Industry benchmarking to compare your incident data to other similar organisations.
Organisations that participate in the UPLOADS Research project are asked to submit de-identified (which has the names of participants, staff members and the organisation removed) incident and participation data to the National Incident Dataset (NID).
When all LOA providers submit their data to the NID, it forms a repository of information that will used by the research team to analyse incidents, contributory factors, and participation data from a national perspective and provide reports to the LOA sector about the:
- frequency on incidents associated with different types of LOA
- characteristics of incidents, injuries, and illnesses that occur during LOA
- network of contributory factors involved in incident causation.
By understanding what incidents are occurring and what contributory factors are involved, we will ultimately understand how to prevent incidents from occurring again.
Use of the UPLOADS app is free to all Australian LOA organisations until 2021!
Development
Aims
The aim of this project is to develop a novel injury and accident surveillance system, underpinned by the systems approach to accident causation and analysis, for the led outdoor activity industry in Australia. This involves translation of the latest thinking on accident causation in the led outdoor activity industry.
Little is currently known about the incidence of injuries during led outdoor activities in Australia, the factors that cause injuries, or the most appropriate prevention strategies for the domain. To tackle this problem, members of the Australian led outdoor activity industry are currently engaged in a program of research with the Monash University Accident Research Centre (MUARC). Stage 1 of the program was completed in 2009, and stage 2 commenced at the end of 2011. A summary of stages 1 and 2 is given below.
Stage 1 – Problem Definition
Stage 1 involved a review of accident causation research in the led outdoor activity domain and an analysis of three led outdoor activity accidents. A workshop involving project stakeholders, led outdoor activity personnel, and researchers from MUARC was then held to disseminate the research findings and determine the most appropriate way forward for the subsequent phases of the research. Based on recommendations arising from the report and workshop, an ARC linkage grant was developed for Phase 2, which received funding at the end of 2011.
Stage 2 – Incident database development and validation
Stage 2 involved the development and trialling of an incident database for the led outdoor activity industry. This involves the following phases of research:
- Incident database development. Prototype incident reporting, storage and analysis methods, including robust data coding and classification systems, will be developed based on incident reports from the led outdoor activity sector. These methods will together form a prototype incident database;
- Prototype database refinement. The prototype database will be trialled by a small number of led outdoor activity providers for 6 months. The lessons learnt during this period will be used to refine the database;
- In-depth incident study. The refined incident database will be utilised by a large cross section of led outdoor activity providers in order to conduct an in-depth study of injury causing incidents over 12 months; and
- Accident causation model development. Based on the findings derived from the former phases, a systems-based model of accident causation for the led outdoor activity domain will be developed. This model will be used by the industry to guide injury prevention efforts.

Note
The UPLOADS Project Team need as many LOA organisations to participate as possible to ensure that the NID outputs provide an accurate overview of trends. If you would like to contribute to the National Incident Dataset, or would like more information, please contact the UPLOADS team at uploadsproject@usc.edu.au
The research project has received ethics approval from the University of the Sunshine Coast (approval no A/13/454).
Incidents in the Outdoors - Infographics
This annual report provides an overview of the incidents reported to the National Incident Database (NID) for the 12-month period of September 14, 2022 to September 13, 2023. The report describes: the incident rates per incident type and activity; the severity of the reported incidents; an overview of the reported injuries and illnesses sustained; and the network of contributory factors reported as playing a role in incident causation. The report also represents a comparison between key variables from the current dataset and the previous UPLOADS annual reports.
Click here to download the infographic
An Honours project used UPLOADS data and a structured survey to investigate whether there are gender differences in adolescents’ help-seeking behaviour and intentions for psychosocial problems in led outdoor activities. Learn more.
Psychosocial problems refer to emotional or psychological challenges causing difficulties in personal or social functioning, which can negatively impact mental health.
The findings suggest that led outdoor activity providers should consider:
- Creating environments and processes that encourage proactive help-seeking behaviours for all participants,
- Developing gender-specific strategies for detecting and responding to psychosocial incidents, and
- Targeted strategies to increase positive help-seeking behaviours for males.
Click here to download the infographic

This infographic presents incident reporting statistics nationally and for each State and Territory including program participation days, total incidents, incident rates, incident severity ratings and most frequently reported contributory factors.
Incidents are influenced by multiple factors, with the data presented a reflection of those variations rather than a comparative analysis. This highlights the importance of a strong commitment to quality data collection, enabling individual operators to tailor program development and risk management strategies to match their unique needs.
Click here to download the infographic


In this infographic, we examine the reported incidents involving animals and insects. In total 700 incidents involving animals and insects have been reported to the National Incident Dataset since 2018. The most frequently reported incidents involved ants, insects, and mosquito bites; however, incidents were reported involving a range of animals including snakes, horses, spiders among many others.
Click here to download the infographic

This annual report provides an overview of the incidents reported to the National Incident Database (NID) for the 12-month period of September 14, 2020 to September 13, 2021.
The report describes: the incident rates per incident type and activity; the severity of the reported incidents; an overview of the reported injuries and illnesses sustained; and the network of contributory factors reported as playing a role in incident causation.
The report also represents a comparison between key variables from the current dataset and the previous UPLOADS annual report.
Click to read/download full REPORT Infographic

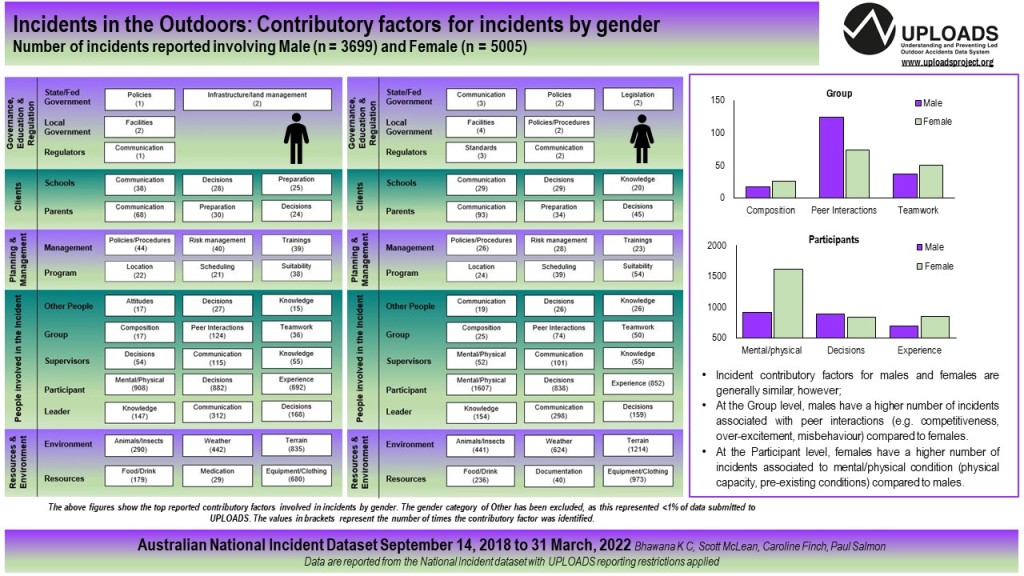
In this infographic, we examine incidents by gender type reported to the National Incident Dataset and highlight the most frequently reported contributory factors.
In total, males have been involved in 3699 incidents, and females involved in 5005 incidents since 2018. The factors contributing to incidents are generally similar for males and females, however, the frequency of the contributory factors differ. For example, females have a higher number of incidents associated with mental/physical conditions compared to males, whereas males have a higher frequency of peer group interactions contributing to incidents. These findings support the need for further research and conversations on this important topic.
Click here to download the infographic.
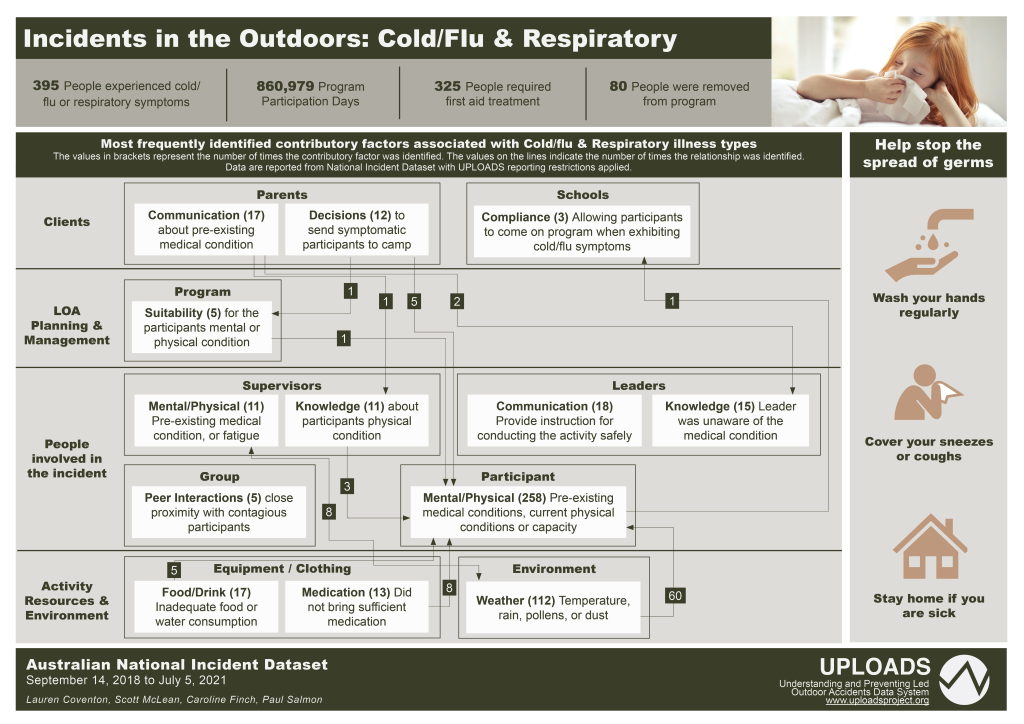
In this infographic we explore the most frequently reported factors that contributed to the Cold/Flu or Respiratory illness incidents that occurred between September 2018 and July 2021. From the 395 reported incidents, 325 people required first aid treatment and 80 were removed from the program.
The participant’s mental/physical condition, such as pre-existing cold/flu symptoms, allergies or asthma, was the most frequently reported contributory factor. There was a frequently reported relationship with compliance and decisions at the client level, suggesting that parents and schools are sending participants to program with cold/flu symptoms or are not providing information about pre-existing respiratory conditions. Weather was also a commonly reported factor, with temperature, rain, pollens, or dust exacerbating cold/flu or respiratory conditions.
Click here to download the infographic.
In this infographic we examine the psychosocial incidents types reported to the National Incident Dataset and report the actual and potential severity of these incidents and their contributory factors.
The contributory factors involved in minor severity incidents were similar to those involved in serious or severe incidents. This highlights the importance of reporting all incidents, regardless of their severity, to support the development of strategies that will help reduce the likelihood and severity of incidents.
Click here to download the infographic.

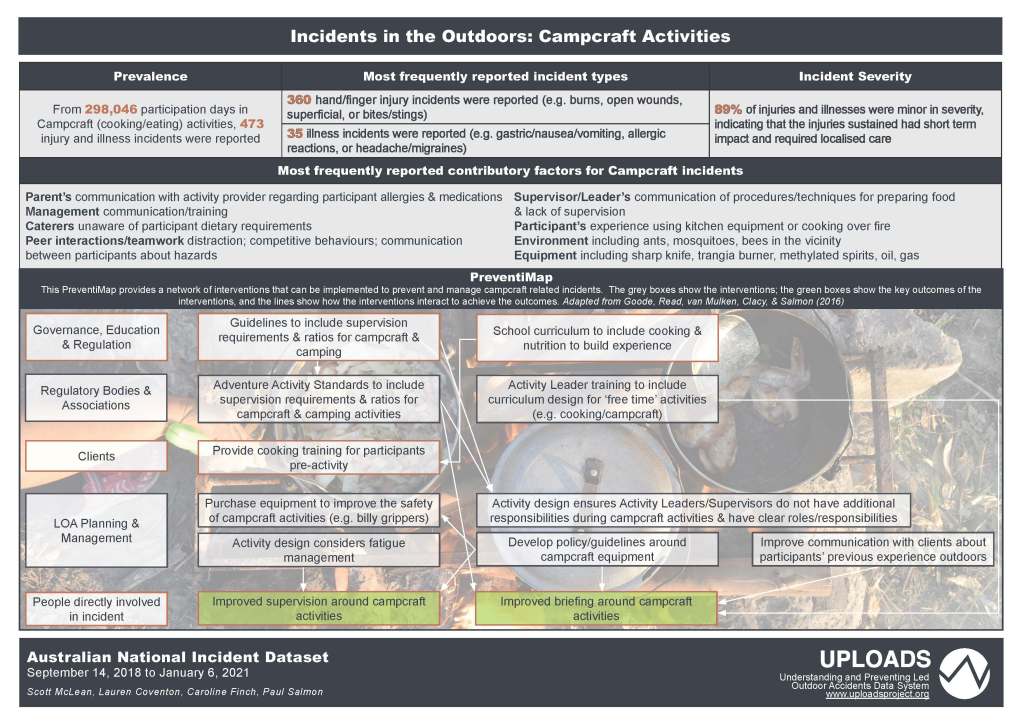
Since September 14, 2018, 473 injury or illness incidents relating to Campcraft Activities have been reported. Although, 89% of these incidents were minor in severity, 7% of the incidents were reported with a potential severity rating of serious, severe or critical.
In addition to an overview of a subset of data we typically provide in our Infographics, such as, the types of incidents and frequently reported contributory factors, this infographic presents a PreventiMap for Campcraft related incidents. The PreventiMap shows a network of interventions that could be explored to prevent and management campcraft related incidents.
This infographic illustrates that:
- Safety is impacted by the decisions and actions of everyone in the system, not just those on the frontline.
- Near misses and adverse events are caused by multiple, interacting, contributing factors, not just a single bad decision or action.
- Effective countermeasures require systemic changes.
Click here to download the infographic.
Weather Related Incidents
In this Infographic we show how the weather has been reported as a contributory factor in LOA incidents. In over two years of data reported to the National Incident Dataset, 724 incidents identified weather as a contributory factor. The Infographic reveals the activities frequently affected by weather, and describes how weather interacts with other factors to contribute to incident causation.
Note: CLICK infographic to view full size

Harness (Outdoors)
This infographic shows the near miss and injury incidents associated with outdoor harness activities.
Note: CLICK infographic to view full size

Cycling
Presenting the most frequently identified contributory factors and relationships associated with incidents involving cycling using the UPLOADS National Incident Dataset.
In line with other analyses, cycling incidents are influenced by factors from multiple levels of the LOA system.
Note: CLICK infographic to view full size

Pre-existing Health Conditions
Of the more than 3000 incidents reported to the UPLOADS National Incident Dataset, 18.8% of incidents were associated with pre-existing health conditions.
This infographic shows the most frequently identified contributory factors, and relationships between factors associated with incidents involving a pre-exiting health condition.
As a sector we need to ask ourselves, what are the design, planning, and program delivery strategies we need to consider and communicate to make outdoor activities safer for those with pre-existing health conditions? To develop strategies and interventions to reduce recurring incidents, use the Preventing Incidents Method (PrIMe).
Note: CLICK infographic to view full size

Heat & Water Related Incidents
Using the UPLOADS National Incident Dataset, we have identified the most frequently identified contributory factors associated with incidents involving in heat and water related activities.
While many of the factors identified are quite obvious, our data shows that they are continuing to occur throughout the year. It is hoped that this infographic is helpful in reminding the LOA sector of the contributory factors associated with heat and water activities.
Note: CLICK infographic to view full size

LOA organisation size may influence incident types and severity.
This infographic from the UPLOADS Team demonstrates that incidents reported to UPLOADS differ regarding activity type, incident type, and incident severity as a function of organisation size.
Check out the infographic and see how your organisation stacks up against the UPLOADS National Incident Dataset.
Note: CLICK infographic to view full size

